Restoring 1000’s of SQL Server Databases Using PowerShell

Recently I have been working with a client who has a production SQL Server instance that has ~2.5k databases on it. They are in the process of moving to a new SQL Serve cluster and are reviewing their other non-production environments too.

One of their major pain points at the is their pre-production refresh process, this involves restoring all 2.5k databases to a pre-production SQL Server instance. The current process involves retrieving backups from Iron Mountain and performing file system restores. They are looking to streamline this process and automate it as much as possible. Most of the process could be achieved using T-SQL, but there are extra file system tasks that need to be performed which are more easily achieved using PowerShell. PowerShell 4.0 brought us the Restore-SQLDatabase cmdlet and so it was worth evaluating this to see if I could encapsulate the entire thing in one script. It’s still a work in progress but here are some snippets from it.

Firstly, I should probably explain that their backups are all stored in a single network share in this structure:

\\BackupRoot\Database\Full\backup.bak

The objective is to restore the most recent full backup of each production database to the pre-production server.

I’ve created some variables at the top of the script (real variable data removed):

$backupRoot = Get-ChildItem -Path "C:\Temp\Databases"
$datafilesDest = "C:\Temp\DataFiles"
$logfilesDest = "C:\Temp\LogFiles"
$server = "SIMON-XPS13\SQL2014" 

A description of the individual commands within the main body is included in the code below.

## For each folder in the backup root directory...
#
foreach($folder in $backupRoot)
{   
    # Get the most recent .bak files for all databases...
    $backupFiles = Get-ChildItem -Path $folder.FullName -Filter "*.bak" -Recurse | Sort-Object -Property CreationTime -Descending | Select-Object -First 1
    

    # For each .bak file...
    foreach ($backupFile in $backupFiles)
    {
        # Restore the header to get the database name...
        $query = "RESTORE HEADERONLY FROM DISK = N'"+$backupFile.FullName+"'"
        $headerInfo = Invoke-Sqlcmd -ServerInstance $server -Query $query
        $databaseName = $headerInfo.DatabaseName

        # Restore the file list to get the logical filenames of the database files...
        $query = "RESTORE FILELISTONLY FROM DISK = N'"+$backupFile.FullName+"'"
        $files = Invoke-Sqlcmd -ServerInstance $server -Query $query

        # Differentiate data files from log files...
        $dataFile = $files | Where-Object -Property Type -EQ "D"
        $logFile = $files | Where-Object -Property Type -EQ "L"

        # Set some variables...
        $dataFileName = $dataFile.LogicalName
        $logFileName = $logFile.LogicalName

        # Set the destination of the restored files...
        $dataFileFullPath = $datafilesDest+"\"+$dataFileName+".mdf"
        $logFileFullPath = $logfilesDest+"\"+$logFileName+".ldf"

        # Create some "Relocate" file objects to pass to the Restore-SqlDatabase cmdlet...
        $RelocateData = New-Object 'Microsoft.SqlServer.Management.Smo.RelocateFile, Microsoft.SqlServer.SmoExtended, Version=12.0.0.0, Culture=neutral, PublicKeyToken=89845dcd8080cc91' -ArgumentList $dataFileName, $dataFileFullPath
        $RelocateLog = New-Object 'Microsoft.SqlServer.Management.Smo.RelocateFile, Microsoft.SqlServer.SmoExtended, Version=12.0.0.0, Culture=neutral, PublicKeyToken=89845dcd8080cc91' -ArgumentList $logFileName, $logFileFullPath

        # Perform the database restore... and then go around the loop.
        Restore-SqlDatabase -ServerInstance $server -Database $databaseName -BackupFile $backupFile.FullName -RelocateFile @($RelocateData,$RelocateLog) -ReplaceDatabase
    }
} 

With this script I was able to restore all 2.5k databases with relative ease. The great thing is that this can be run in just a few clicks and is much less arduous than the previous process. This script is unlikely to suit your exact use case but hopefully you can take from it what you need and tailor it to your environment.

If you have any questions, then please don’t hesitate to contact me.

Choosing the right tool for the job

I was working with a client recently when an architect expressed disdain for a particular part of the SQL Server stack. In this particular case the architect had then chosen to roll-their-own solution which they felt was better. My intention is not to comment on their particular solution but it did set my mind thinking… do I let previous bad experiences cloud my judgment and adversely affect my solution proposals?

It might work, but is it the best way?


During my career I have worked with all manner of tools and products, I have worked with consultants and technical experts to work out solutions to complex problems. Now, in my role as a consultant it is important to capture a business’s requirements and map those onto technical requirements. By then designing a solution to meet the technical requirements it should follow that the business requirements are met. In the end, if I don’t meet the business requirements then project sponsors will see no value in the work I have done, no matter how hard I’ve worked, or how good my solution might be and the project will be deemed a failure.


One size does not fit all

If we consider a SQL Server related project, when trying to find solutions to technical requirements I always consider all of the options.

Something in here will do the job!


In a previous role I worked with transactional replication. Now, we had terrible trouble with our publication but that hasn’t stopped me from recommending it to clients where it has been the best solution to their particular requirement. For a slightly different requirement backup and restore might have been appropriate, always-on availability groups with a readable replica may have been a viable solution, using SSIS to copy data from A to B would have been another solution, but the best one for that client, at that time, was transactional replication. So even though I’d previously had some trouble with it, I was still able to recognise that it was the best tool for the job.

When it comes to technical solutions, one size most definitely does not fit all. There isn’t one way to provide High Availability (HA) or Disaster Recovery (DR) for a SQL Server database. There isn’t one way to build a data warehouse. There isn’t one way to design SSAS cubes or OLAP models. Indeed, if there was, my services as a consultant wouldn’t be in such demand. I can’t emphasise how important it is to step back and look at your problems without bias and pre-meditation. Only with a truly agnostic view can you design the best solution to solve a problem. Just because it didn’t work for you before doesn’t mean you shouldn’t consider it, and with regards to rolling your own solutions, just be sure you’re not re-inventing any wheels.

Creating an Availability Group with Microsoft Azure

Have you ever wanted to try out SQL Server Availability Groups but never had enough spare tin lying around in order to setup an environment? Well the Azure portal has been updated and now you don’t need to have any physical kit lying around, nor do you need to worry about having a beefed up laptop running Hyper-V!

All you need is an MSDN subscription that allows you an amount of Azure credit. Luckily I have a premium subscription which entitles me to £65 of Azure credit every month. Firstly you’ll need to login to your MSDN subscription and activate your Azure subscription and then you’re ready to go!

At the end of August the SQL Server team announced the release of SQL Server Always On Azure portal gallery item. Prior to this particular gallery item being available if you wanted to configure an Always On Availability Group (AG) you needed to create all the individual machines that comprise the infrastructure manually. This would include setting up the virtual network, configuring the domain and then configuring SQL Server. The addition of the gallery item greatly simplified the task of creating and automating an AG.

In this tutorial I will show you where to find this gallery item and how to use the Azure portal to configure a SQL Server 2014 Always On Availability Group server setup.

1)      Using a web browser navigate to http://portal.azure.com and log into your Azure subscription. Once you’re logged in you will be presented with a screen that looks similar to the below.

001 - Portal


2)      Click ADD in the bottom left hand corner, then click “Everything”

002 - Gallery1


3)      Click Data, storage, cache + backup and you should see an option for SQL Server 2014 AlwaysOn (you may also have seen this option available at other points in this process).

003 - Gallery2


4)      Once you have selected the SQL Server 2014 AlwaysOn option the screen below appears. Complete the fields with your chosen user names and passwords. The Resource Group is a name for a collection that makes it simple to see and manage related Azure resources.

004 - AGConfig001


5)      Once complete select the SQL Server Settings – Configure Settings option. Specify a host name prefix, an availability group name, and a name for the availability group listener. Clicking PRICING TIER will allow you to select from 3 pre-defined pricing options for your SQL Servers, there is also an option to browse all pricing tiers. I selected the 4 core 28GB variant.

005 - AGConfig002


6)      Ensure that you give the SQL Server Service account a descriptive name and appropriately strong password. Once finished click OK.


7)      Moving into the domain configuration, the first thing is to specify a hostname prefix (I’ve used the same prefix as in step 5). Give your domain a name and select the pricing tier for your domain controllers.

006 - AGConfig003


8)      Configuring a virtual network is easy. Specify a name for your virtual network and an IP address range.

007 - AGConfig004


9)      Storage accounts within Azure are containers for blob storage. All hard disks associated with Azure VMs are treated as blob storage and therefore you must specify a storage account to hold them. The account must have a unique name. If you have already created a storage account then you may use this to store your VMs. Select an appropriate pricing model.

008 - AGConfig005


10)   Once the storage is configured the only thing left to do is to choose the data centre where you want your VMs to be strored. I have chosen Northern Europe (Dublin). Click Create and you’re done!

009 - AGConfig006


The creation process takes about an hour to complete but can vary depending on the time of the day. Once the creation is complete you will be able to see all of the VMs that were created to form the solution by select Browse – Virtual Machines from the Auzure Portal landing page.

Now you can start adding databases to your availability group! I hope you’ve found this tutorial useful.

Azure is great for quickly creating a proof of concept, or sandbox environment that you can play about in. More importantly Azure has the capability to provide an enterprise scale platform once your POC has been proven. I would encourage you to create all your POC’s in Azure from today. Too many times I’ve worked for companies where great ideas have been shelved and forgotten because the procurement process for physical kit, or reliance on virtualisation teams was hampering the exploration ideas.

Cloud providers are dramatically changing the speed of delivery for IT. I for one am completely sold on “The Cloud” and the more I explore the Azure platform the more excited I am about my upcoming projects and how it can help!

SQL Server Data Files in Azure – Part 1 – Creating a database

One of the interesting new features of SQL Server 2014 was being able to place SQL Server database files directly in Azure blob containers. The purpose of this post is to walk you through setting up a database with its data and log files in Azure. In a later post I plan to test the performance of a database configured this way.

Why would you want to put data files in Azure?

Ease of migration – You could almost consider Azure blob storage to be a NAS in the cloud with unlimited storage potential. You can host your data and log files in Azure but your databases are on local SQL Server instances. When migrating databases between servers it would be as simple as issuing a detach and attach command and hey presto, you’re done.

Cost and storage benefits – Buying disks for on premises servers is relatively cheap these days when compared to the cost of SQL Server licensing. The cost of storing blobs in Azure can be found here: https://azure.microsoft.com/en-gb/pricing/details/storage/ but your first 1TB is (at the time of writing) is charged from as little as £0.0147 per GB which is hard to beat. You can store up to 500TB in each storage account, but one restriction to be aware of is that the maximum size of a page blob (the type we need) is 1TB. This means you may need to create more data files in your file groups if you have databases greater than 1TB in size.

Disaster recovery – Disaster recovery plans might be greatly simplified. Having a HA on premises solution to handle minor non-catastrophic outages is always something I advise. Having standby kit for the purposes of DR can be expensive, especially when you consider the likelihood you’ll ever need it might be slim. If you DR plan is to simply quickly stand-up a new server in an alternate location, you don’t want to have to worry about fetching off site backups or copying files over to the new location (if you can get them!). Simply re-connect your server to the Azure blobs!

Snapshot backup – Whilst I always advise taking traditional SQL Server backups, it is possible to use Azure snapshots to provide near instantaneous backups. For more information on that feature see here: https://msdn.microsoft.com/en-us/library/mt169363.aspx

How do we do it?

We’re going to be using PowerShell to do a lot of the configuration for us. I’ll be creating a new database but it is also possible to migrate databases you already have (I’ll include some script to help with that too).

I will be using the ARM (Azure Resource Manager) version of Azure and its associated PowerShell. If you’re using ASM (Azure Service Manager (Classic)) then you may need to alter the script a little.

So the steps we need to complete are:

  1. Create a resource group
  2. Create a storage account
  3. Create a container
  4. Create an access policy
  5. Create a shared access signature
  6. Create a SQL Server credential
  7. Finally, create our database

Use the PowerShell below to address steps 1 – 5. Comments in the code will help you to understand what is happening at each stage.

# Set these to your subscription name, storage account name, and a new container name
#
$SubscriptionName='SimonCoeo'
$resourceGroupName= 'simontestazureblob'
$StorageAccountName='simontestazureblob'
$location= 'North Europe'

# Set the Azure mode to ARM
#
Switch-AzureMode -Name AzureResourceManager
New-AzureResourceGroup -Name $resourceGroupName -Location $location
New-AzureStorageAccount -Type Standard_LRS -StorageAccountName $storageAccountName -ResourceGroupName $resourceGroupName -Location $location

# A new container name, must be all lowercase.
#
$ContainerName='simontestazureblob'

# Sets up the Azure Account, Subscription, and Storage context
#
Select-AzureSubscription -SubscriptionName $subscriptionName
$accountKeys = Get-AzureStorageAccountKey -StorageAccountName $storageAccountName -ResourceGroupName $resourceGroupName
$storageContext = New-AzureStorageContext -StorageAccountName $storageAccountName -StorageAccountKey $accountKeys.Key1

# Creates a new container
#
$container = New-AzureStorageContainer -Context $storageContext -Name $containerName
$cbc = $container.CloudBlobContainer

# Sets up a Stored Access Policy and a Shared Access Signature for the new container
#
$permissions = $cbc.GetPermissions();
$policyName = 'policy1'
$policy = new-object 'Microsoft.WindowsAzure.Storage.Blob.SharedAccessBlobPolicy'
$policy.SharedAccessStartTime = $(Get-Date).ToUniversalTime().AddMinutes(-5)
$policy.SharedAccessExpiryTime = $(Get-Date).ToUniversalTime().AddYears(10)
$policy.Permissions = "Read,Write,List,Delete"
$permissions.SharedAccessPolicies.Add($policyName, $policy)
$cbc.SetPermissions($permissions);

# Gets the Shared Access Signature for the policy
#
$policy = new-object 'Microsoft.WindowsAzure.Storage.Blob.SharedAccessBlobPolicy'
$sas = $cbc.GetSharedAccessSignature($policy, $policyName)
Write-Host 'Shared Access Signature= '$($sas.Substring(1))''

# Outputs the Transact SQL to create the Credential using the Shared Access Signature
#
Write-Host 'Credential T-SQL'
$TSQL = "CREATE CREDENTIAL [{0}] WITH IDENTITY='Shared Access Signature', SECRET='{1}'" -f $cbc.Uri,$sas.Substring(1)

Write-Host $TSQL

Once that has executed take the T-SQL Script that was generated as the output and run that on the instance of SQL Server where you want to create your database.

-- Output From PoSh
CREATE CREDENTIAL [https://simontestazureblob.blob.core.windows.net/simontestazureblob] 
WITH IDENTITY='Shared Access Signature', 
SECRET='Your SAS Key'

And for our final step, a relatively straightforward CREATE DATABASE command.

-- Create database with data and log files in our Windows Azure container.
CREATE DATABASE TestAzureDataFiles 
ON
( NAME = TestAzureDataFiles,
    FILENAME = 'https://simontestazureblob.blob.core.windows.net/simontestazureblob/TestAzureData.mdf' )
 LOG ON
( NAME = TestAzureDataFiles_log,
    FILENAME = 'https://simontestazureblob.blob.core.windows.net/simontestazureblob/TestAzureData_log.ldf')

AzureDataFiles1

Now that, that has been created we can look to compare the performance of our Azure hosted database against a locally stored database. Once I’ve got some test results to share I’ll post with Part 2.

The curious case of the slowly starting cluster

I came across an interesting case today that I thought it was worth doing a quick blog post about. I was working with a customer who was migrating onto their newly built SQL Server 2014 clustered instance. Part of the pre-migration testing was to fail the SQL Server service between the two nodes to ensure it started correctly. What we found was that SQL Server service wouldn’t accept incoming client connections, or appear “online” in failover cluster manager for around 75 seconds. Given the number of databases, virtual log files and resources I would have expected failover to happen much more quickly.

Reviewing the SQL Server error log we found that there were many scripts that were being executed “upgrading databases” before the message: “SQL Server is now ready for client connections. This is an informational message; no user action is required.” appeared. Upon investigation what we found was that one of the nodes was running SQL Server 2014 Service Pack 1, the other was running SQL Server 2014 RTM.

In order to identify this we ran the following query on the current active node:

SELECT
SERVERPROPERTY('ProductVersion') AS ProductVersion,
SERVERPROPERTY('ProductLevel') AS ProductLevel,
SERVERPROPERTY('Edition') AS Edition
GO

We then failed the service over onto the other node and ran the query again. The product level on the two nodes was different, one reporting RTM the other reporting SP1. Once the RTM node was upgraded to SP1 we were able to fail the SQL Service between the two nodes in under 15 seconds.

Always make sure that nodes in your SQL Server clusters are running at the same patch level!

Creating an SSRS Report with a Dynamic Datasource

I’ve been asked this question a few times recently and so thought I’d put it on the blog as a “how to”.

This is going to be a basic report only to demonstrate the concepts and steps required in order to create a report that has a dynamic datasource. The data that this report returns isn’t going to be particularly useful but it serves as a nice demo regardless.

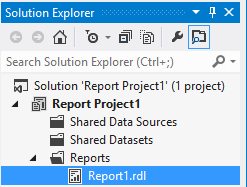
So… first things first start a report project and create a new report.

NewReport

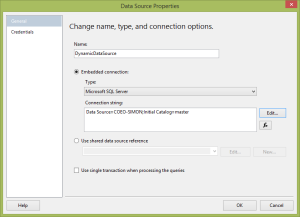
Create a datasource (not a shared datasource).

DataSource

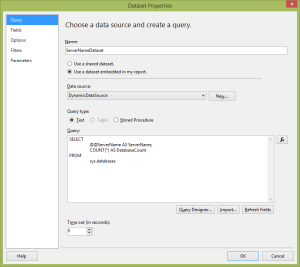
Create a dataset that uses the datasource you’ve just created.

DataSet

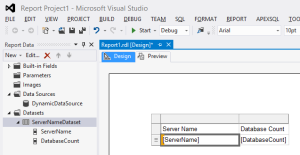
Create a very simple report.

SimpleReport

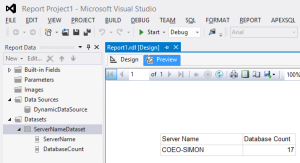
Preview the report to ensure that it’s working.

Preview1

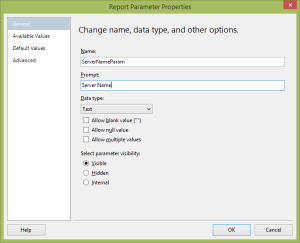
Now, to make it dynamic I’m going to add a server name parameter.

ParamProp1

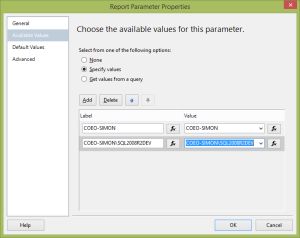
ParamProp2

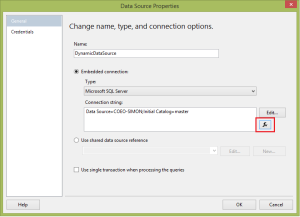
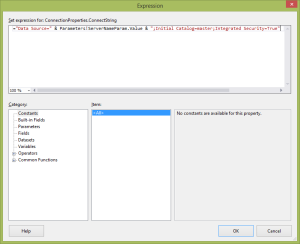
Having done this I need to alter the data source connection string to make use of the new parameter.

DataSourceExprButton

DataSourceExpr

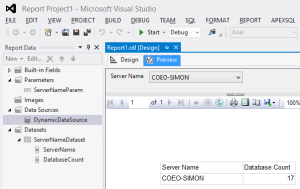
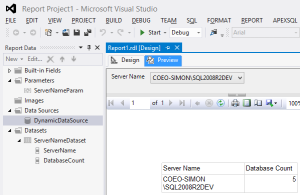
Click OK and then OK on the datasource properties box. Then when you preview your report again you have a dropdown list containing the two servernames. Select the server you want to run the report against and you should see that you get the server name and database count from each one.

Preview2

Preview3

As I said this is a very simple example of a report you can run using a dynamic datasource but it demonstrates the steps required. The most common example of where this sort of functionality can be useful is creating custom dashboards for server estates. You could even have a database table that contains all your server names, and alter the properties of the servername parameter to get its list of servers from that table. The possibilities are endless!

Happy reporting!

Have you enabled Lock Pages in Memory?

Firstly for those that already know about this feature of Windows, have you enabled this permission to your SQL Server service account? If not why not? I’d be interested to know so please leave a comment below.

For those that don’t know….

What is Lock Pages in Memory?

Lock pages in memory is a Windows user permission that you can grant to the SQL Server service account that prevents Windows from paging significant portions of your buffer pool out to disk.

Why should we enable this?

Your buffer pool is the one of the most important parts of SQL Server, it’s your cache, you want to protect it as much as you can! If you find entries in your SQL Server error log that read like this:

“A significant part of SQL Server process memory has been paged out. This may result in a performance degradation.”

Essentially this means that something from the OS is trying to steal memory from SQL Server. If you can identify what it is and stop this from happening then brilliant! Otherwise enable the Lock Pages in Memory setting. The usual culprit for stealing memory is an anti-virus program, but it could be anything that requires a large amount of memory.

How do you enable Lock Pages in Memory?

Essentially in order to resolve the issue follow these instructions:

To enable the lock pages in memory option

  • On the Start menu, click Run. In the Open box, type gpedit.msc.
  • On the Local Group Policy Editor console, expand Computer Configuration, and then expand Windows Settings.
  • Expand Security Settings, and then expand Local Policies.
  • Select the User Rights Assignment folder.

The policies will be displayed in the details pane.

  • In the pane, double-click Lock pages in memory.
  • In the Local Security Setting – Lock pages in memory dialog box, click Add User or Group.
  • In the Select Users, Service Accounts, or Groups dialog box, add the SQL Server service account.
  • Restart the SQL Server service.

Once enabled you should find the error no longer occurs in your error logs.

**Important side note**

Ensure that you set the max memory option in your SQL Server properties. If you don’t SQL Server could then take all the memory away from the OS which could create more problems.

Measuring Query Performance

This is a quick post about measuring query performance. How do you know that changes you’ve made to improve a query are actually beneficial? If all you’re doing is sitting there with a stop watch or watching the timer in the bottom right corner of SQL Server Management Studio then you’re doing it wrong!

Here’s a practical demonstration of how I go about measuring performance improvement. First let’s setup some demo data.

/* Create a Test database */
IF NOT EXISTS (SELECT * FROM sys.databases d WHERE d.name = 'Test')
CREATE DATABASE Test
GO

/* Switch to use the Test database */
USE test
GO

/* Create a table of first names */
DECLARE @FirstNames TABLE
(
 FirstName varchar(50)
)
INSERT INTO @FirstNames
SELECT 'Simon'
UNION ALL SELECT 'Dave'
UNION ALL SELECT 'Matt'
UNION ALL SELECT 'John'
UNION ALL SELECT 'James'
UNION ALL SELECT 'Alex'
UNION ALL SELECT 'Mark'

/* Create a table of last names */
DECLARE @LastNames TABLE
(
 LastName varchar(50)
)
INSERT INTO @LastNames
SELECT 'Smith'
UNION ALL SELECT 'Jones'
UNION ALL SELECT 'Davis'
UNION ALL SELECT 'Davies'
UNION ALL SELECT 'Roberts'
UNION ALL SELECT 'Bloggs'
UNION ALL SELECT 'Smyth'

/* Create a table to hold our test data */
IF OBJECT_ID('Test.dbo.Person') IS NOT NULL
DROP TABLE dbo.Person

/* Create a table of 5,764,801 people */
SELECT
 fn.FirstName,
 ln.LastName
INTO dbo.Person
FROM
 @FirstNames fn
 CROSS JOIN @LastNames ln
 CROSS JOIN @FirstNames fn2
 CROSS JOIN @LastNames ln2
 CROSS JOIN @FirstNames fn3
 CROSS JOIN @LastNames ln3
 CROSS JOIN @FirstNames fn4
 CROSS JOIN @LastNames ln4
GO

The features I use to track query performance are some advanced execution settings. These can be switched on using the GUI through Tools > Options > Query Execution > SQL Server > Advanced. The two we’re interested in are: SET STATISTICS TIME and SET STATISTICS IO.

These can be switched on using the following code:

/* Turn on the features that allow us to measure performance */
SET STATISTICS TIME ON
SET STATISTICS IO ON

Then in order to measure any improvement we make later it is important to benchmark the performance now.

/* Turn on the features that allow us to measure performance */
SET STATISTICS TIME ON
SET STATISTICS IO ON

/* Benchmark the current performance */
SELECT * FROM dbo.Person p WHERE p.FirstName = 'Simon'
GO

By checking the messages tab we can see how long the query ran for (elapsed time) how much CPU work was done (CPU Time) and how many reads were performed.

(823543 row(s) affected)
Table 'Person'. Scan count 5, logical reads 17729, physical reads 0, read-ahead reads 0, lob logical reads 0, lob physical reads 0, lob read-ahead reads 0.
SQL Server Execution Times:
 CPU time = 1623 ms, elapsed time = 4886 ms.

So… now to make a change that should yield an improvement.

/* Create an index to improve performance */
CREATE INDEX IX_Name ON dbo.Person(FirstName) INCLUDE (LastName)
GO

Now re-measure the performance…

/* Turn on the features that allow us to measure performance */
SET STATISTICS TIME ON
SET STATISTICS IO ON

/* Benchmark the current performance */
SELECT * FROM dbo.Person p WHERE p.FirstName = 'Simon'
GO
(823543 row(s) affected)
 Table 'Person'. Scan count 1, logical reads 3148, physical reads 0, read-ahead reads 0, lob logical reads 0, lob physical reads 0, lob read-ahead reads 0.
SQL Server Execution Times:
 CPU time = 249 ms, elapsed time = 4488 ms.

Looking at the two sets of measurements we can see that we’ve saved 398ms of elapsed time, we’ve saved 1,374ms of CPU time and we’re doing 14,581 less reads. This is a definite improvement.

The critical thing about this approach is that we’re able to scientifically measure the improvement and therefore relay this onto anyone that may be interested whether that’s a line manager or end customer.

Happy performance measuring!

SSAS Cube Processing Performance Troubleshooting – A platform perspective

Analysing Index Usage

The first step I use in order to troubleshoot cube processing performance issues is index usage.

SELECT DB_NAME(S.database_id) AS [Database],
 OBJECT_NAME(S.[OBJECT_ID]) AS [Table],
 I.name AS [Index],
 user_seeks,
 user_scans,
 user_lookups,
 user_updates
FROM sys.dm_db_index_usage_stats AS s
 JOIN sys.indexes AS i
 ON i.object_id = s.object_id
 AND I.index_id = s.index_id
WHERE
 OBJECTPROPERTY(s.object_id,'IsUserTable') = 1
 AND s.database_id = DB_ID()

Look at any recently added indexes. Are the indexes being used? Seeks, or scans? Is there an index that has a large no. of user lookups?

Where there is an index that is not being used consider whether it is required. Having too many indexes on a table can have an adverse effect on performance. When rows are inserted, deleted or updated in a table the index needs to be maintained. Maintenance has an overhead. The above query has an output column called user_updates. This is the no. of times an index has been changed as a result of data changes within the table.

Find Missing Indexes

Use the following query to identify missing indexes.

SELECT TOP 25
 DB_NAME(dm_mid.database_id) AS DatabaseID,
 dm_migs.avg_user_impact*(dm_migs.user_seeks+dm_migs.user_scans) Avg_Estimated_Impact,
 OBJECT_NAME(dm_mid.OBJECT_ID,dm_mid.database_id) AS [TableName],
 'CREATE INDEX [IX_' + OBJECT_NAME(dm_mid.OBJECT_ID,dm_mid.database_id) + '_'
 + REPLACE(REPLACE(REPLACE(ISNULL(dm_mid.equality_columns,''),', ','_'),'[',''),']','') +
 CASE
 WHEN dm_mid.equality_columns IS NOT NULL AND dm_mid.inequality_columns IS NOT NULL THEN '_'
 ELSE ''
 END
 + REPLACE(REPLACE(REPLACE(ISNULL(dm_mid.inequality_columns,''),', ','_'),'[',''),']','')
 + ']'
 + ' ON ' + dm_mid.statement
 + ' (' + ISNULL (dm_mid.equality_columns,'')
 + CASE WHEN dm_mid.equality_columns IS NOT NULL AND dm_mid.inequality_columns IS NOT NULL THEN ',' ELSE
 '' END
 + ISNULL (dm_mid.inequality_columns, '')
 + ')'
 + ISNULL (' INCLUDE (' + dm_mid.included_columns + ')', '') AS Create_Statement
FROM
 sys.dm_db_missing_index_groups dm_mig
 INNER JOIN sys.dm_db_missing_index_group_stats dm_migs ON dm_migs.group_handle = dm_mig.index_group_handle
 INNER JOIN sys.dm_db_missing_index_details dm_mid ON dm_mig.index_handle = dm_mid.index_handle
WHERE
 dm_mid.database_ID = DB_ID()
ORDER BY
 Avg_Estimated_Impact DESC

Be aware that the DMV’s will highlight several indexes for the same table. Be sure not to add multiple indexes that may be duplicates or subsets of other indexes. The create index statement is provided in the output.

Finding Query Plans in the Cache

The following query will help you identify long running queries in the plan cache:

SELECT TOP 20
 DB_NAME(qt.dbid) AS [Database],
 [Query] = SUBSTRING (qt.text,(qs.statement_start_offset/2) + 1,
 ((CASE WHEN qs.statement_end_offset = -1
 THEN LEN(CONVERT(NVARCHAR(MAX), qt.text)) * 2
 ELSE qs.statement_end_offset
 END - qs.statement_start_offset)/2) + 1),
 [TotalRunTime (s)] = CAST(qs.total_elapsed_time/ 1000000.0 AS DECIMAL(28,2)),
 [TotalTimeWaiting (s)] = CAST((qs.total_elapsed_time - qs.total_worker_time) / 1000000.0 AS DECIMAL(28,2)),
 [%TimeRunning] = CAST(qs.total_worker_time * 100.0 / qs.total_elapsed_time AS DECIMAL(28,2)),
 [%TimeWaiting] = CAST((qs.total_elapsed_time - qs.total_worker_time)* 100.0 / qs.total_elapsed_time AS DECIMAL(28, 2)),
 [ExecutionCount] = qs.execution_count,
 [AverageRunTime] = CAST(qs.total_elapsed_time / 1000000.0 / qs.execution_count AS DECIMAL(28, 2)),
 [AverageTimeWaiting (s)] = CAST((qs.total_elapsed_time - qs.total_worker_time) / 1000000.0 / qs.execution_count AS DECIMAL(28, 2)),
 [QueryPlan] = qp.query_plan
FROM
 sys.dm_exec_query_stats qs
 CROSS APPLY sys.dm_exec_sql_text(qs.sql_handle) as qt
 CROSS APPLY sys.dm_exec_query_plan(qs.plan_handle) qp
WHERE
 qs.total_elapsed_time > 0
 AND DB_NAME(qt.dbid) IS NOT NULL
 AND qt.text LIKE '%<INSERT SEARCH STRING HERE>%'
ORDER BY
 [AverageRunTime] DESC

Using this query, currently ordered by average run time, will allow you to identify queries that take a long time to run. The queries with the highest average run time are likely to be the SSAS cube partition processing queries. The query above will allow you to look at the query plans associated with the query. Look for expensive scans and key lookups.

Alter the where clause of the above query if you are looking for queries that use specific views or tables.

Add indexes to support long running queries.

Eliminating Key Lookups

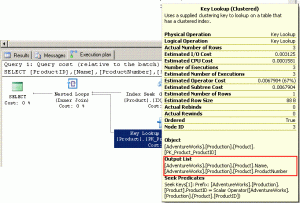
keylookup

Eliminate key lookups by altering existing indexes or add new covering indexes.

To identify columns that need adding to existing indexes look at the output columns associated with the keylookup plan operator. A screenshot of this is shown above. Keylookups are an expensive operation that needs to be performed for every row in a result set. By adding these keys to the existing index as included columns SQL Server can read the data it needs straight from the index pages.

ACCESS_METHODS_DATASET_PARENT – Not one I’d heard of either!

I was doing some database tuning recently and I found a missing index that I wanted to add. This is a reasonably straightforward thing to want to do, so I scripted it up and executed the command and went to grab a coffee.


CREATE INDEX IX_Test ON dbo.Test(TestColumn);

<5 minutes passes>

So, I come back to my desk only to find that the index hasn’t finished creating yet! This was unexpected since it was a reasonably narrow index on a table that was only 2-3GB in size.

Using some queries to dig into the DMV’s and a look at the waits I see my index is waiting on LATCH_EX with a latch class of ACCESS_METHODS_DATASET_PARENT, and it had been waiting from the moment I left my desk! This was not a wait type I was familiar with so some research was required.

Reaching for my favourite search engine I soon stumbled upon this blog post from Paul Randal http://www.sqlskills.com/blogs/paul/most-common-latch-classes-and-what-they-mean/.

Basically following his advice and doing some digging I found that the MAXDOP on this server was set to 0 which is the default. This is a 24 core server and I wouldn’t normally advise setting MAXDOP to 0 on a server of this size. The cost threshold for parallelism was set to 5 (also the default) which is quite low considering the workloads performed by this box.

In order to get around the problem I discussed changing the MAXDOP of this server to 8 but the team responsible for it didn’t want to make the change at that time, and opted to change it at a later date. Great, what now? I needed this index and I needed it now…

On this occasion I opted to reach for a MAXDOP hint. For those that didn’t know, you can apply a MAXDOP hint to an index creation statement. The syntax is shown below:


CREATE INDEX IX_Test ON dbo.Test(TestColumn) WITH (MAXDOP = 4);

This time when I executed the script the index creation took only 2 minutes, and the procedures that needed it were now executing much faster than before.

Essentially I’ve written this post in the hope that it helps someone else out if they stumble across the same problem. Aside from Paul’s blog linked above I couldn’t really find any other useful troubleshooting advice for this particular issue. Happy troubleshooting!